Bitcoin Price Prediction in 2024 - Bitcoin's Forecast
In this article, we will briefly analyze as the Bullish Way trading group team how the price of Bitcoin will be in 2024. Without any further ado, let’s get straight to the main point.
To start the technical analysis, we need to analyze the historical chart of Bitcoin. The chart below beautifully illustrates that Bitcoin has been supported by the middle line of the main parent channel and is moving towards the ceiling of the main historical channel, represented by the blue channel, which is a child channel of the main parent channel.
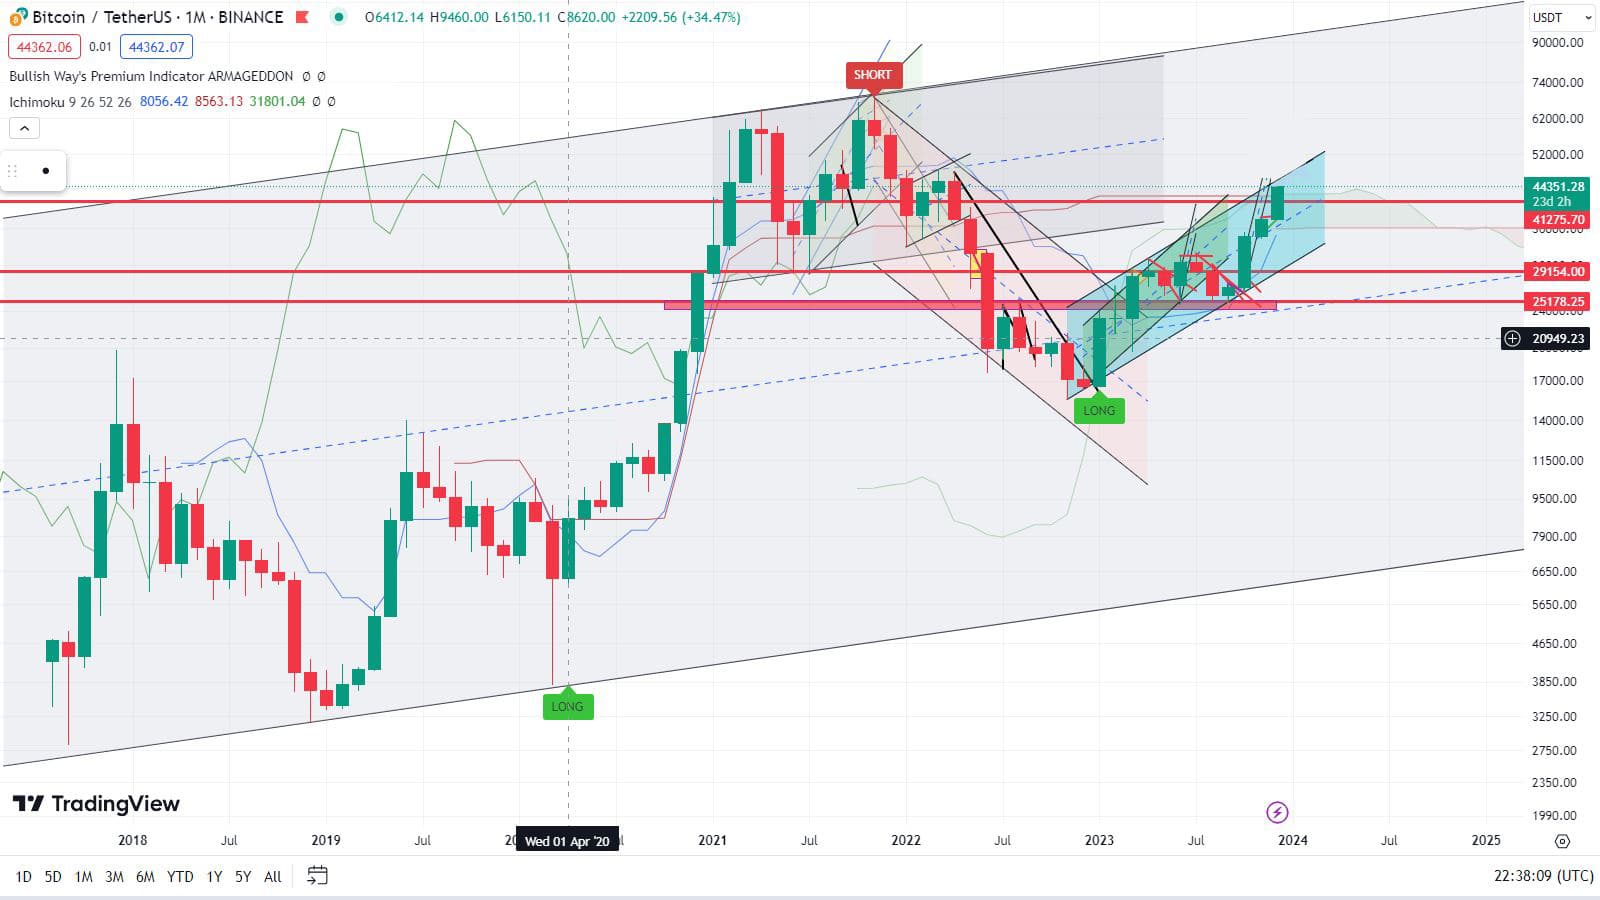
In this technical analysis conducted by Bullish Way team, Bitcoin has consistently shown reactions to the bottom, ceiling and midline of this historical channel.
On this chart, two indicators, Ichimoku and Bullish Way’s Premium Indicator “ARMAGEDDON” have been activated.
Since the beginning of Bitcoin’s listing on the Binance exchange until now, the BullishWay’s premium Armageddon indicator has given three signals in the monthly (long-term) timeframe. The long signal was issued for the first time at a price of $6,209 in April 2020. The short signal was issued for the second time at a price of $68,407 in November 2021. And finally, the long signal was issued for the last time at a price of $16,200 in January 2023.
Pay attention that the signals issued at the best market trend reversal points have been generated, and as of today, December 9, 2023, when this article is written, no short signal has been issued by the Bullish way’s Armageddon indicator. Therefore, the previous long signal is still valid.
So until a sell signal is not issued by Bullish Way’s premium indicator “Armageddon”, we conclude that Bitcoin is moving towards the ceiling of the main channel, which is approximately $94,000.
There are two obstacles that need to be clarified in the face of this movement towards the ceiling of the main channel. The first and most important obstacle is the resistance of the Ichimoku cloud’s ceiling. In the image below, the monthly candle that is currently above the cloud has been zoomed in. The monthly candle needs to close above the cloud and be confirmed in the subsequent monthly candles.
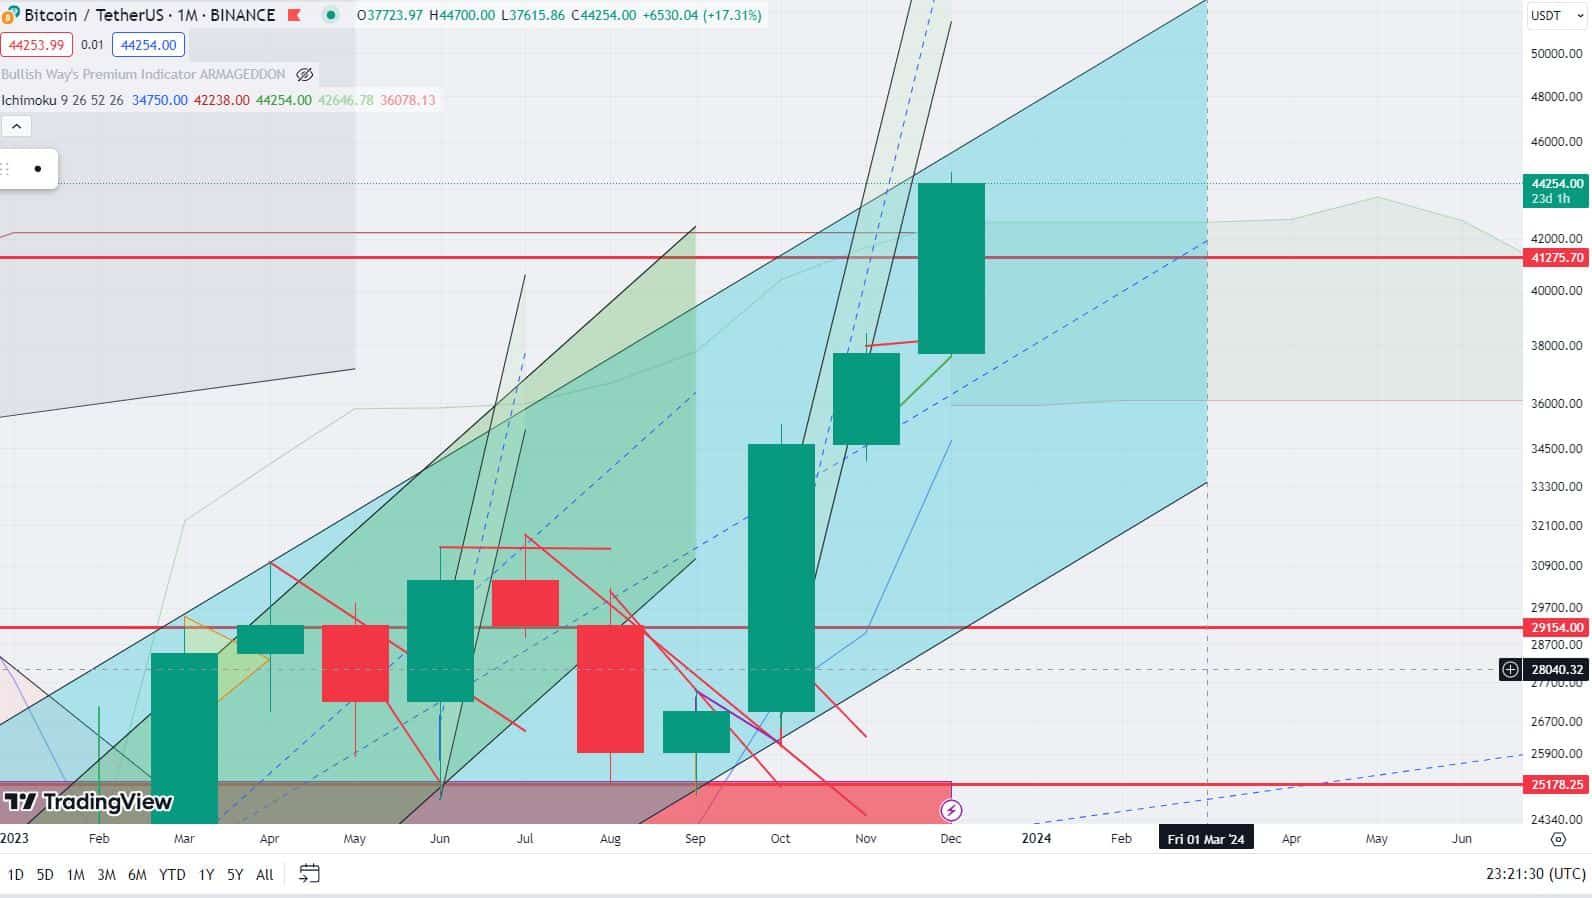
The second obstacle is the ceiling of the blue channel, which is a child channel of the main parent channel. Currently, Bitcoin has reached the resistance level of this channel’s ceiling. By overcoming these two important resistances, provided that the Bullish Way’s Armageddon indicator does not signal a short, we will reach the ceiling of the main channel in 2024.
Through the link below, you can access the Bullish way’s Armageddon indicator, which is the best TradingView indicator issues accurate buy/sell trading signals in all timeframes on all markets, including crypto, forex and stock market.
Analysis update in 2024 January 23 :
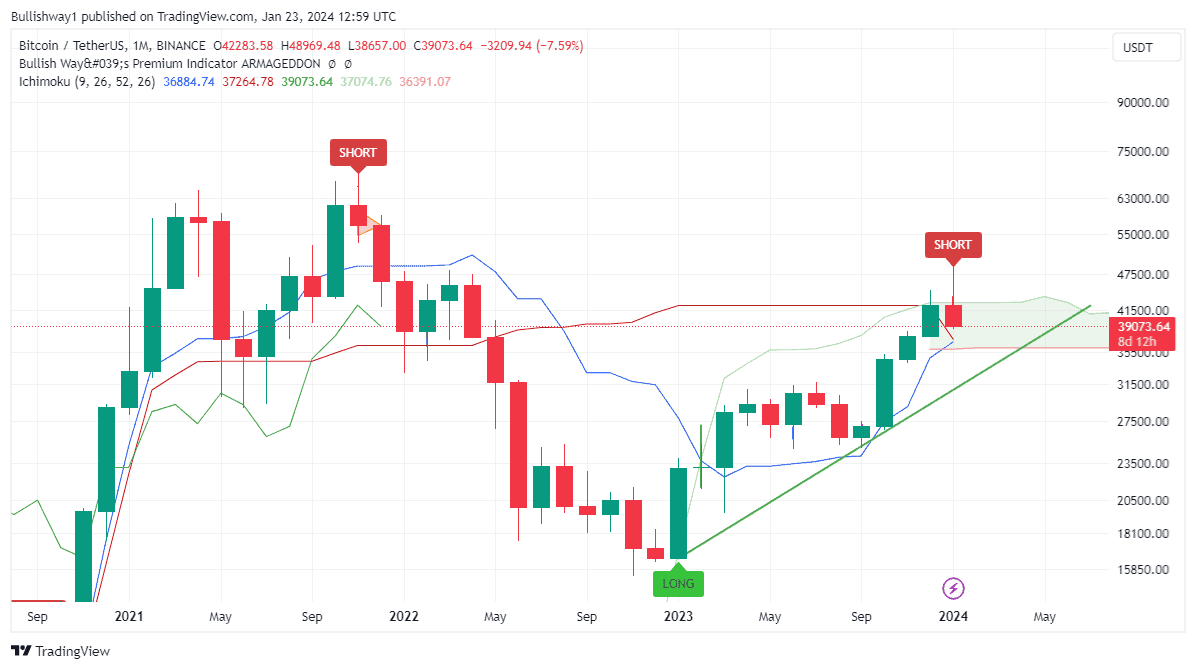
Approximately two months later, we are updating the analysis.
You can observe the Bitcoin chart on the monthly timeframe. The previous monthly candle failed to close above the monthly Kumo cloud. It retraced and closed inside the Kumo cloud. Additionally, above the current monthly candle, the Premium Bullish Way premium indicator “Armageddon2” has given a SHORT signal. However, this monthly candle must close, and the short label should still be present to confirm the short signal from the Armageddon2 indicator.
Based on these explanations, Bitcoin is expected to move towards the bottom of the monthly Kumo cloud, which is around $36,000.
If, after breaking below the daily Kumo cloud, the green trendline is breaked out, Bitcoin may witness even lower levels in the continuation of the year.