

Navigating Bitcoin’s Macro Shifts
In the fast-paced world of cryptocurrency trading, understanding macro structures on higher timeframes is essential for long-term survival. Market participants constantly look for reliable frameworks to map out price movements rather than reacting to short-term noise. Taking a close look at the historical weekly timeframe chart of Bitcoin reveals a critical juncture for the market, where macro trendlines and psychological levels intersect.
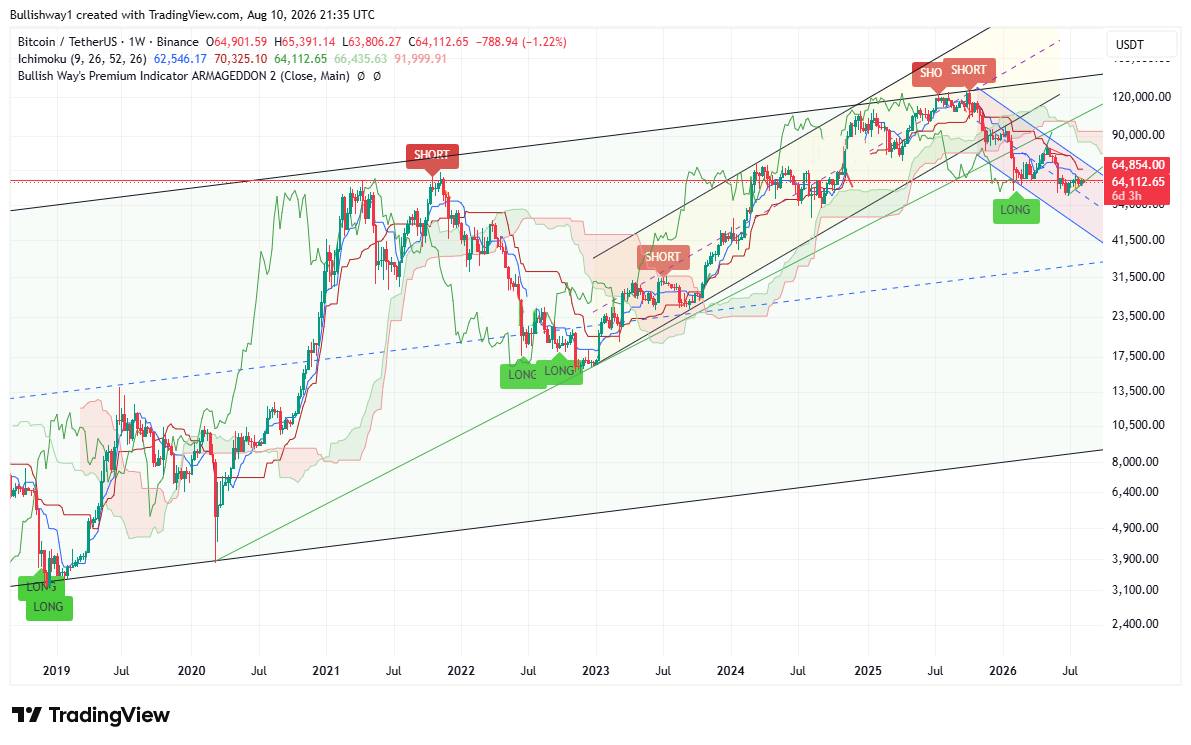 Bitcoin weekly chart showing the descending channel and key technical levels.
The Breakdown of Key Historical Levels
After touching the upper ceiling of the historical macro channel (marked in green), Bitcoin faced heavy rejection, entering a deep correction and price decline. This rejection marked the end of the previous impulsive wave, forcing the asset into a consolidation and retracement phase.
The most crucial line of defense for the bulls was the floor of the ascending channel (marked in yellow), which unfortunately failed to hold under increasing selling pressure. Once this key structural support was lost, the downward price movement gained significant momentum, shifting market dynamics entirely and triggering liquidation cascades across lower timeframes.
Current Price Action: Inside the Pink Descending Channel
Currently, the price is steadily declining inside a pink descending channel, and the market is consolidating until one of these two pivotal scenarios unfolds over the coming weeks:
What is Smart Money Doing? (Actionable Trading Plan)
In terms of professional execution, smart money remains patient and avoids emotional entries throughout the coming weeks:
- Phase One Execution: Smart money will only step in upon a confirmed breakout above the pink channel’s ceiling, targeting the floor of the weekly Ichimoku cloud as an initial milestone.
- Risk Management: Until that structural breakout happens, the medium-term outlook dictates that Bitcoin remains confined within the pink descending channel. Day traders and swing traders alike should avoid forcing positions inside the current range, making strict risk management and patience essential.